Mitigating Indoor Health Risks with Armstrong Ceiling Solutions
Dr. Michael Gao, MD
Nathan Perilo
Ben Siegel
Haven Diagnostics AI-driven predictive modeling analyzes and quantifies health risk mitigation with Armstrong solutions: AIRASSURE Ceiling Tiles and VIDASHIELD UV24 Air Purification Systems.
Decisions about HVAC configurations are more carefully considered now than they were two years ago. Infectious disease risks have always existed, but the most recent pandemic has brought them sharply into focus. As a result, measures to reduce these risks will be an important factor in new developments for return to work. Efficient filtration, ventilation and HVAC configuration can play a key part in mitigating these risks. Armstrong’s products are able to increase both ventilation and filtration as independent systems, or in addition to an already sound filtration system. Our model predicts that, when implemented properly and in combination, Armstrong AIRASSURE Ceiling Tiles, VIDASHIELD UV24 Air Purification Systems, and Fan Filter Units can reduce the indirect spread of respiratory viruses by up to 25% and can be an important component in reducing COVID-19 risk.
Abstract
- Epidemics and pandemics happen frequently, and respiratory transmission of viruses through aerosols and droplets is an important concern beyond COVID-19.
- Besides individual behavior, the most important factors for reducing aerosol concentration of airborne viruses are ventilation and filtration.
- When configured correctly, and used in combination, Armstrong AIRASSURE Ceiling Tiles, VIDASHIELD UV24 Air Purification Systems, and Fan Filter Units can reduce the indirect spread of respiratory viruses by up to 25%.
Background
Many people falsely believe the COVID-19 pandemic is a unique, a one-time occurrence. But while the mortality and morbidity of the SARS-CoV-2 virus are much greater than usual, epidemics and pandemics happen frequently. In developed countries located outside of tropical climates, these are most commonly due to respiratory viruses, such as those listed below:
Respiratory viruses transmit both by aerosols and by droplets, and the amount produced varies widely by activity. Larger droplets, greater than 100 μm, have a more ballistic trajectory and fall to the ground within a relatively short distance (this is commonly referred to as the ‘six-foot rule,’ although they can travel further). Smaller aerosol particles, however, can float in the air for extended periods and may cause indirect exposure to the virus.
The first major advancement in quantifying airborne infection rates was performed by Wells (1955) and Riley et al. (1978), resulting in the creation of the Wells–Riley equation. Their equation allows for the estimation of infection rate based on the number of infective and susceptible people in a space, their breathing rate, the room ventilation rate, and the length of exposure.
The basis for their advancement was the insight that not all inhaled droplets and aerosols will result in infection. Rather, at low levels of exposure, there is an approximately linear relationship between the number of droplets and aerosols inhaled and the probability of infection.
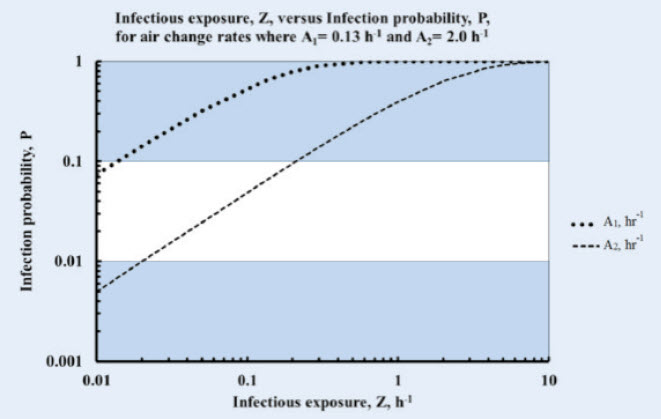
This equation serves as the cornerstone for estimating transmission within Haven Diagnostics’ agent-based model and is also widely used in other risk-estimation methodologies, for example for estimating the risk of COVID-19 transmission during air travel (Marcus 2020), evaluating the effectiveness of personal protective equipment (gammaitoni & Nucci 1997), and measuring tuberculosis risk in buildings (Nardell et al. 1991).
Although the fundamentals of the Wells-Riley equation were groundbreaking, it was, until recently, challenging to translate this to real-world environments.
Haven Diagnostics’ model endeavors to improve upon real-world applicability through agent-based modeling, which accounts for the unique behaviors of people throughout their workday and the effects of a heterogeneous set of environments. For example, this model takes into consideration the movement of employees throughout their workspace to attend meetings, have lunch, and use the restroom. Additionally, the model considers behaviors that affect the magnitude of droplet and aerosol released into the environment, like the use of facemasks.
Haven Diagnostics has created the model by supplementing the Wells-Riley equation with data from over 450 medical articles measuring various properties of airborne diseases, such as droplet dispersion distance and viral decay rates at different temperature and humidity levels.
The model has been validated against a database of superspreader events as well as proprietary data across 4M+ square feet of workspaces.
Modeling disease spread
The approach Haven Diagnostics takes is to model the office environment by simulating four main contributing factors that are present in the office:
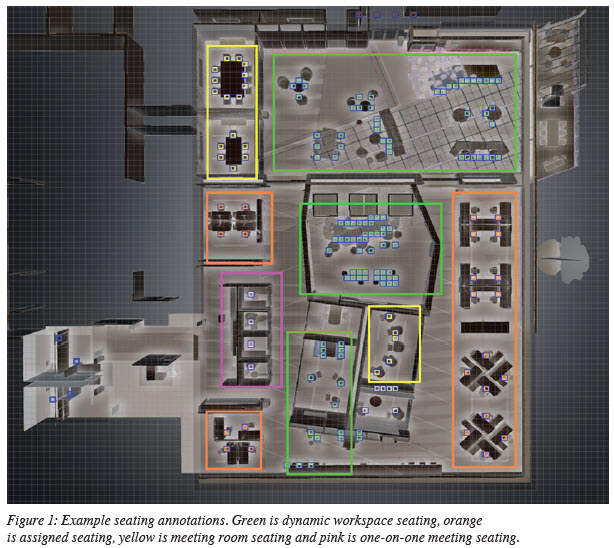
- Office personnel behavior: meetings, common area gatherings, restroom use, talking.
- Physiological knowledge of aerosol emission during various activities.
- Viral decay based on environmental settings: temperature, UV exposure, and humidity.
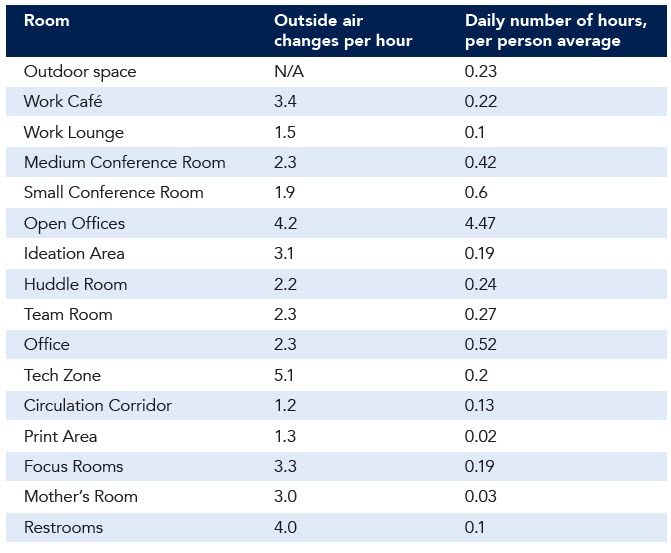
- HVAC configuration: source/return vent location, airflow between rooms, airflow rate at each duct, fresh air changes per hour, air handling unit (AHU) filtration level and room pressurization.
Behavior
Office personnel behavior assumes current best practices, including the use of facemasks, social distancing where possible, and avoidance of prolonged time in common areas where possible. These behaviors are critical for reducing direct spread from person-to-person (i.e. a droplet flying directly from Person A to Person B), which makes ventilation and filtration to reduce indirect spread more meaningful.
We model behavior based on a randomized version of a schedule template, as even small variations of behavior can demonstrate a significant impact on aerosol exposure. And because employee schedules vary day by day, for each office environment we simulate 1,000 random but bounded schedules for each employee.
The schedule template is customizable per office location, but generally varies by industry and team function. In the case of our modeling study with Armstrong World Industries, we created teams of 4 people for the sparse office setup and 18 people for the dense office setup.
Concretely, an example schedule template is as follows:
IT Group
Group size: 4 people (+/- 2 with a positive skew)
Team meetings: 1.5 people (+/- 0.5 with a positive skew)
Intra-team meetings
- IT group members meet with sales team members
- Average of 1 per week
- 3 members per team
- Division-wide meeting
- Average of 1 per month
- Entire team attends
Arrival Schedule
- Employees arrive individually
- Employees arrive during a 45-minute window at the start of the day
Meals
- 25% chance of having lunch together in the common area.
- 50% chance of having lunch alone in the common area.
- 15% chance of leaving the office for lunch.
- 10% chance of having lunch while sitting at the work desk.
Aerosol emission
The simulated behaviors affect both the location each person is in a building during the simulation and the amount of aerosols that the person emits. For example, talking on the phone produces roughly 4.5 - 10x more aerosols than sitting quietly. Droplet emission also varies between people even if they are engaged in the same activity. Some factors that determine an individual’s aerosol emission profile can be captured by the model, such as sex, weight and age. However, there are also factors that impact aerosol emission that add variability. To capture this variability, we apply some stochastic behavior to the emission rate per individual in the simulations.
Viral decay
Throughout the course of the day, virus particles outside of the human body become inactive due to denaturing, and this can be accelerated due to increased heat, exposure to UV light, or settling on the floor and low-touch surfaces (where they are unlikely to cause direct transmission). Of note, indoor environments typically have minimal UV light due to filtering by commercial window coating, which plays a role in why outdoor spaces have so little transmission risk relative to indoors.
The main characteristics of an aerosol that determine how long it stays in the air are its size and evaporation rate. Therefore, environmental factors such as humidity and temperature have a significant effect on viral half-life.
HVAC and active filtration
Besides individual behavior, the most important factors for reducing aerosol concentration are ventilation and filtration. In modern offices, the HVAC system is largely responsible for both factors, including removing air from inside a specific room, actively introducing outside air into the building, and filtering recirculated air. Numerous characteristics of the system contribute to the efficacy of the HVAC system as a whole, including air changes per hour, MERV filtration levels, intake of outside air schedule, duct placement, plenum efficiency and any advanced filtration options employed.
In our model, we simulate air movement by tracking temperature and pressure changes through the volume of the entire space and AHU. Pressure is provided by the source HVAC blowers (and any other fans present) and pressure flows by means of air transmission toward low pressure areas of the floor. The low-pressure areas of the floor are the return air ducts and any other fans present on the floor.
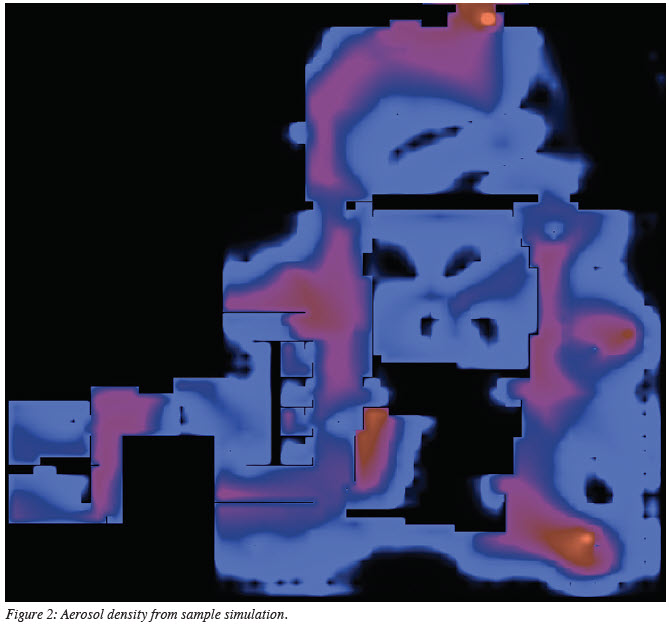
The output of the model simulations are density maps of aerosols for each time step throughout the day (Fig. 2).
Armstrong Products
Armstrong provided Haven Diagnostics with technical data on their products, including AIRASSURE ceiling tiles and VIDASHIELD UV24 air purifiers, and one industry standard Fan Filter Units (FFU).
AIRASSURE Panels
Per the Armstrong technical specifications, the standard ceiling panels have a leakage rate up to 4X of that with AIRASSURE seals. AirAssure ceiling tiles also increase through-ceiling filtration effectiveness by up to 40%. This is in comparison to typical drop ceilings where air from the plenum and the room permeate the ceiling panel to grid interface. Aerosol and droplets, of course, cannot traverse barriers such as walls. However, there is the potential for air flow through the plenum: this cross-barrier movement of air not only impacts the efficiency of the AHU recirculation, but it also allows for unfiltered air to traverse the floor regardless of structural layout.
Cross barrier movement can theoretically cause spread of aerosols from room to room through the plenum. When we modeled the aerosol movement in open areas of the floor, such as the 800 square foot coworking café, the effect of having a plenum in the room versus not having a drop ceiling on aerosol transmission was not pronounced. However, where there were meeting rooms and private offices next to each other, or next to coworking spaces, the aerosol leakage between the rooms did have an effect on transmission.
To model the effect of AIRASSURE ceiling technology on adjacent rooms, Haven and Armstrong conducted an experiment that measured CO2 levels in a source room and the room adjacent. This was accomplished using dry ice as the CO2 source and measuring the resulting CO2 concentration in the adjacent room.
In our testing, without AIRASSURE ceiling tiles, 16.6% of CO2 was transferred from the Source Room to the Adjacent Room. With AIRASSURE ceiling tiles 11.6% of CO2 was transferred from the Source Room to the Adjacent Room (a 30.1% reduction).
Fan filter units
Fan filter units are installed on the return grates as ceiling tiles. They act to filter any air entering the plenum so that any air that enters the plenum has some measure of filtration. The fan filter also provides a pressure gradient between the plenum air volume and the room air volume. For spaces that use the filter fan unit for all return vents, this minimizes room to room aerosol flow and is functionally similar to using ducted return vents.
We also modeled configurations in which there are fan filters installed on select return vents. In such configurations, the rooms where they are employed saw a measurable improvement in reducing aerosol transmission through to the plenum, and therefore to other locations on the floor though normal return grates. In this configuration, the migration into the room of external aerosols remained near zero, even though plenum air contained some aerosols from locations without filter fan units.
Armstrong VIDASHIELD UV24 Air Purification Units
The VIDASHIELD UV24 products are standalone fan units that funnel air over a high-powered UV-C light source. The process neutralizes 97% of pathogens in one pass, per the product’s technical studies. These units can throughput 3200 cubic feet per hour and can be placed specifically where aerosol buildup would be highest without modifying existing HVAC ductwork.
We modeled two different configurations of the VIDASHIELD UV24 units. In one configuration, we used the result of an earlier simulation run to understand where the majority of aerosol buildup would occur and placed 6 VIDASHIELD UV24 units around the floor in those locations. The other configuration had 23 VIDASHIELD UV24 units installed around the floor in both high and low traffic areas.
Results
We modeled an office with the above characteristics at two levels of density: low density (24 people), and high density (108 people) using a COVID-19 prevalence that matched the United States average in July 2020, October 2020, and February 2021 (about 1.2% actively infected). Each scenario was run 1,000 times to account for a variation in behaviors.
In the base case scenario with an exposed plenum and 24 people, 3.2 cases of COVID-19 transmission (on average) were detected over one year, with a standard deviation of 1.8 cases.
In the base case scenario with an exposed plenum and 108 people, an average of 35.7 cases of COVID-19 transmission (+/- 9.3 cases) were detected. Of note, the variance captured here is dependent on the most recently available data and estimates as of March 2021, and new information about the transmission of SARS-CoV-2 and its variants may impact the results.
We then added various Armstrong and other products in our model to understand the reduction in risk afforded by their addition. Of note, the locations of the VIDASHIELD UV24 units and Fan Filter Units were optimized based on locations of maximum aerosol and droplet dispersion.
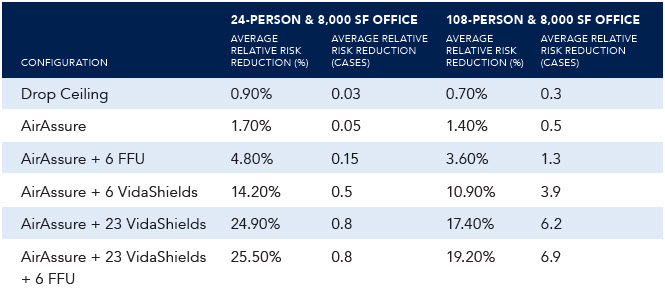
These decreases in risk are comparable to, or significantly more effective than, many other interventions commonly employed by companies. For example, “deep cleaning” the office likely reduces risk by less than 1%, and one-way directional arrows likely has a negligible effect, and even daily temperature screening has a sensitivity of just 8 - 18% depending on the cutoff used for fever (Bielecki 2020).
Summary
Decisions about HVAC configurations are more carefully considered now than they were two years ago. Infectious disease risks have always existed, but the most recent pandemic has brought them sharply into focus. As a result, measures to reduce these risks will be an important factor in new developments for return to work. Efficient filtration, ventilation and HVAC configuration can play a key part in mitigating these risks. Armstrong’s products are able to increase both ventilation and filtration as independent systems or in addition to an already sound filtration system. Our model predicts that, when implemented properly and in combination, Armstrong AIRASSURE Ceiling Tiles, VIDASHIELD UV24 Air Purification Systems, and Fan Filter Units can reduce the indirect spread of respiratory viruses by up to 25% and can be an important component in reducing COVID-19 risk.
Appendix
Core office policies assumed during simulation:
- Facemask use when within six feet from others
- Avoidance of group activities in café and other break areas
- Social distancing beyond six feet where possible
- Maximum conference room capacities and meeting lengths
- Avoidance of going to work when sick was NOT assumed (the frequency at which employees arrived to work with COVID-19 is equal to the historical national prevalence)
Disclaimer
This report is for informational purposes only. It represents analysis and views of relative risk reduction based on Haven Diagnostics proprietary modeling and inputs from Armstrong World Industries regarding various workplace scenarios and referenced products. Results of real-world applications will vary and are dependent upon a wide range of factors, conditions and assumptions.
©2021 Haven Diagnostics
Additional Resources
Ceiling Airflow Containment and Control
Explore the benefits of reducing leakage through the ceiling plane, providing designers and operators better control of their space.
A Case for Suspended Ceiling Technologies
A simple building product could play an important role in reducing the spread of COVID-19 and airborne pathogens.
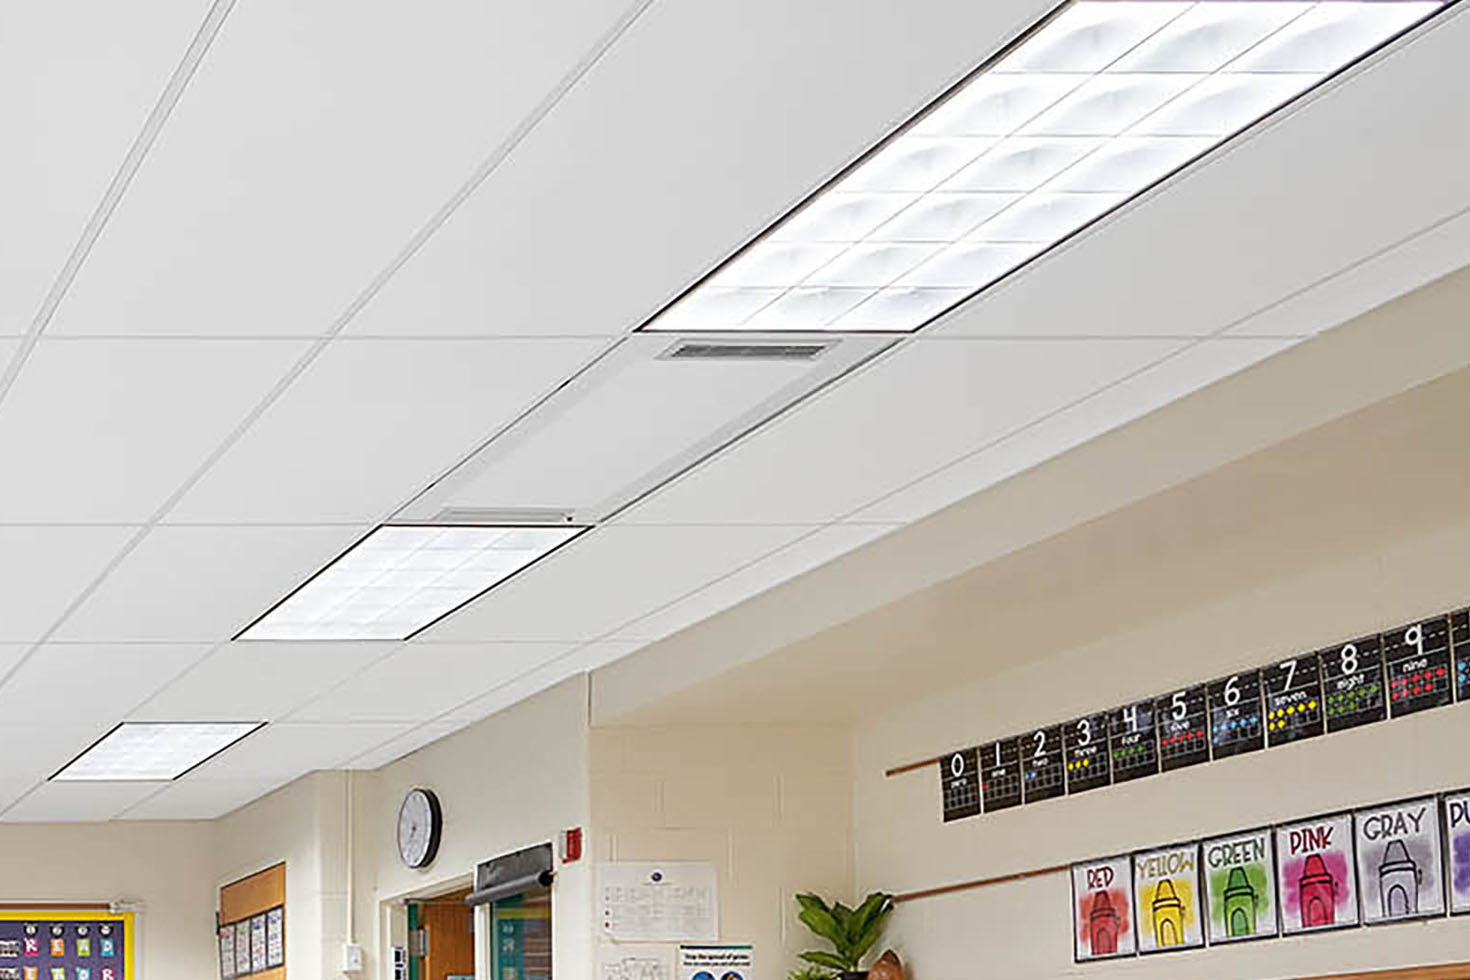
Cleaner Air For Classroom
See how Neff Elementary School classrooms were retrofitted for improved indoor air quality from the top down.